What's next in googleway: colours
Due: version 2.4
Up until now I've left it up to the user to define the colours to use for shapes and map layers.
I've now finally written the code that allows you to map a variable in your data to a colour. By default googleway uses the viridisLite::viridis colour scale, because they are quite possibly the best colour palettes I've seen
Each plotting function now also takes a palette argument, where you can pass in your own palette function to generate the colours
## until v2.4 is released you'll need the development version
devtools::install_github("SymbolixAU/googleway")
library(googleway)

mapKey <- symbolix.utils::mapKey()

## using a categorical varirable
google_map(key = mapKey) %>%
  add_polygons(data = melbourne, polyline = "polyline",
               fill_colour = "SA2_NAME", fill_opacity = 0.8,
               stroke_colour = "SA2_NAME")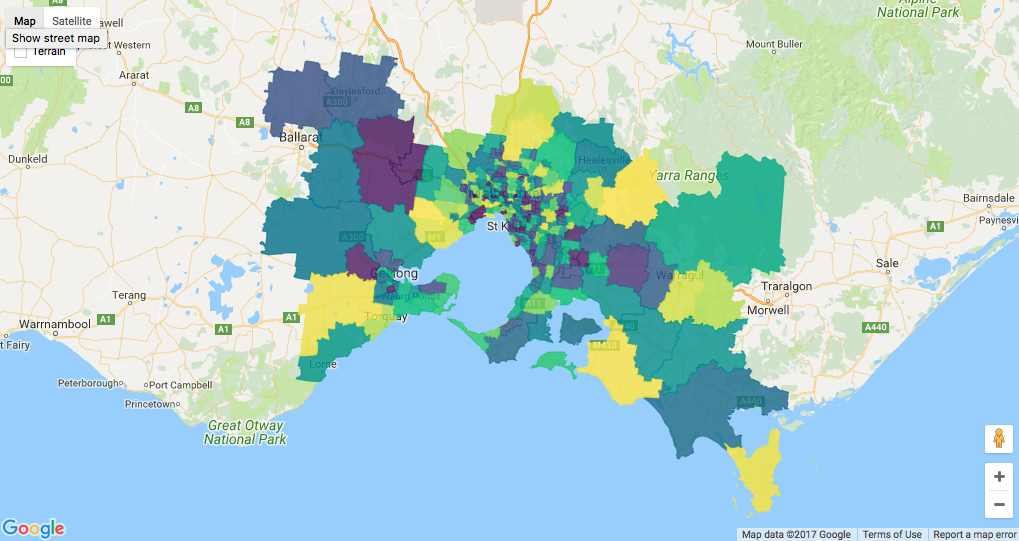
## using a numerical variable, and specifying a palette
google_map(key = mapKey) %>%
  add_polygons(data = melbourne, polyline = "polyline",
               fill_colour = "polygonId", fill_opacity = 0.8,
               stroke_colour = "polygonId", palette = viridisLite::plasma)
For more updates about googleway or any of our open source projects, come and visit us at our github page: https://github.com/SymbolixAU