Where's the centre of Victoria? (finding metrics fit for purpose)

With the large volume of data (and in particular spatial data) floating about, we mere humans are often resigned to attempting to describe these data with single measures, such as an average. But there is a lot in an average, and you'll often find data scientists avoiding the term.
Watch.
In this Australian Bureau of Statistics link, we are shown the the centre of population as an average (see the Explanatory Notes in the link for an explanation of the calculation). In this instance, we have been shown the arithmetic mean, which is the average that everyone knows - add everything up and divide by the total population.
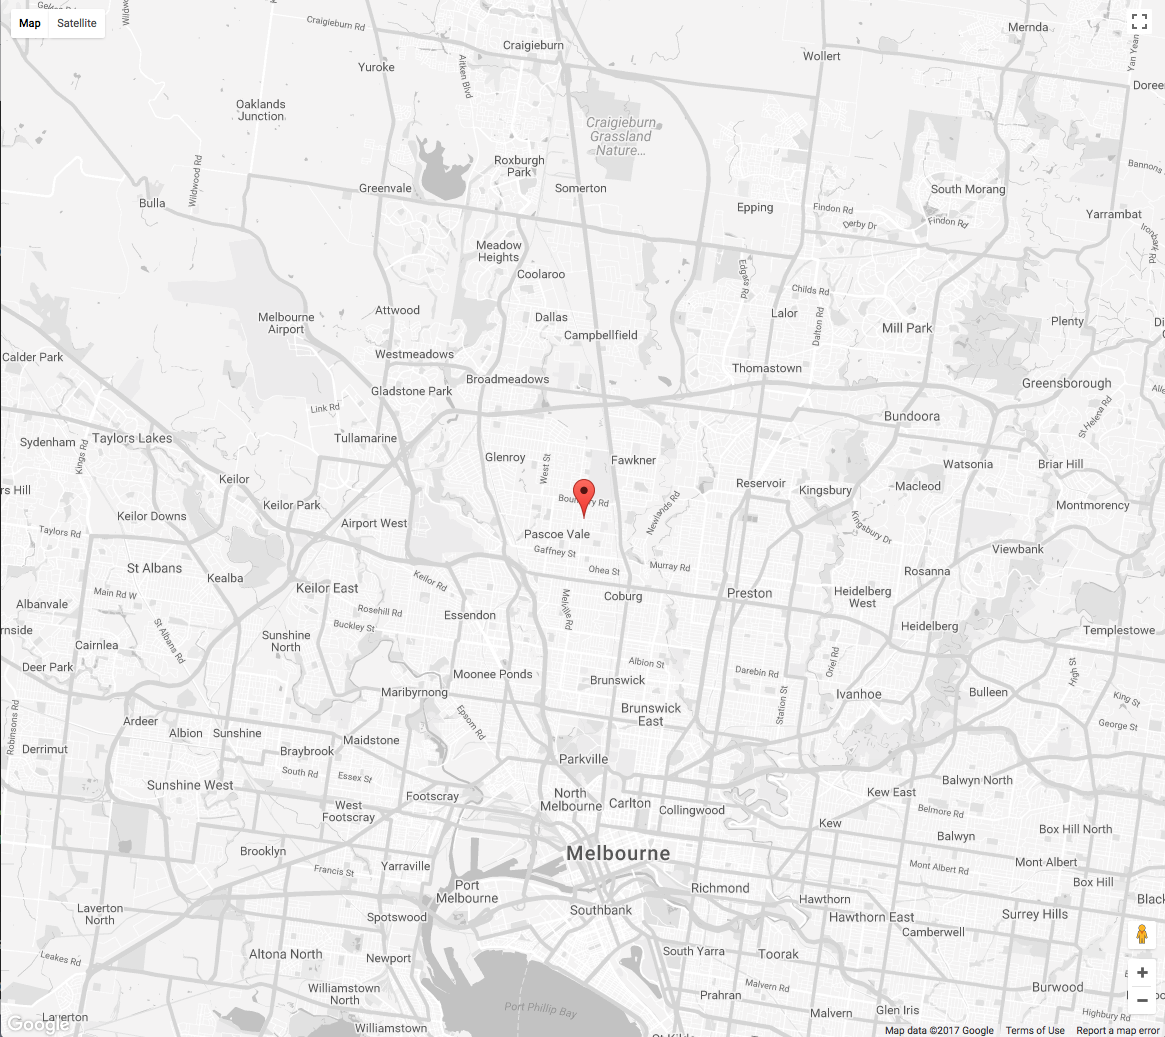
Here it is for Victoria. We can see that it is located north of the CBD, around the suburb of Coburg.
But what does it really mean?
"Well, it's the average" just doesn't cut it. And, realistically, it is a pretty poor measure. The arithmetic mean in this case is not very helpful. It can be considered as "where you might put the card table, if everyone in Victoria were to visit, and you wanted to minimise the total square of their distance travelled."
What? The square of the distance travelled is not a particularly good economic rule. There are very few, if any transport modes where the cost increases as the square of the travelled distance. Furthermore, when working with an effective penalty that follows the square of the distance, the fact that there is a coast line to the south means that the average will be dragged further north than in general people may expect. Averages, and the leveraged nature of distance squared means that, even if nearly everyone lived on the coast and only one person did not, the average would be dragged northward seemingly disproportionately.
So, we can use more appropriate averages for determining "balance" points of a spatially distributed population.
Minimum total shoe wear
Instead, let us use the absolute distance itself as a penalty measure, rather than squaring it. Where would we put the card table? This minimises the distance that everybody would have to travel to reach it, so can be used for finding optimal locations.
In Victoria, this point is on the banks of the Yarra, near Bridge Road. That's more like what people might expect. And it is a more accurate economic average.
Percentage cost
Rather than simply shoe wear and tear, we can look at distance leverage. If a person walks 1 km and we say "do you mind if you walk one more kilometre up the road?", that is a different impost to saying to a driver who has just driven one hundred kilometres "will you drive one more?"
If we take a common percentage term as the penalty, that is choose the average so that the overall annoyance due to distance is minimised, we would all meet in Richmond.
Again, for those who live and work in Victoria, Richmond is a more conceptual centre than Coburg.
This is not remarkably different to the economic concept of a person "gravity" model, which has a centre of population in the same place in this case. Gravity models don't have a leverage based on percentages, but instead say that the penalty goes not as the distance squared, nor the distance itself, but as the inverse of distance.
Super-gravity
For a true city centric view of Victoria, without dastardly manipulations, we might use a penalty that is the reciprocal of that used in the original averaging done by the ABS. That is, one over the square of the distance. This gives a real tapering effect. Originally, the average was built around the concept of travelling twice as far cost four times as much. Now we look at an average where it is cheaper to move large distances than short. An example would be using rail infrastructure or transport where labour is a considerable fixed cost.
Lo, the super-gravity balance point is right in the middle of the CBD.
So, what?
The point here is about choosing metrics that measure what you want, and not just one that can be found in a Google search. We have demonstrated a number of cost functions which be used in different scenarios. In fact, we can really use any cost function we want, with as much complexity that we we want - the important thing is that it is fit for purpose. Should you choose a metric because it is robust, or one that is sensitive? Choice and properties of metrics are important questions. You cannot have a race car that is both highly manoeuvrable and agile, and simultaneously stable and docile. The same goes for metrics.
With data, and particularly big data, it can be hard to distinguish between noise and signal. A sensitive metric like the arithmetic mean will get the jitters due to noise (such as a miscoded place name a long way away). Conversely, a robust metric like a gravity model may not see a trend until far into its run.
A point to consider is, how do you measure the sensitivity of the various averages? But that is a topic for another time.
The below map illustrates the locations of the different types of averages (click on the markers to see which is which).
If you would like to know more about our spatial and demographics services please drop us a line.