Spatial habitat assessment: where are the critters?
© SymbolixWhere? Tasmania, Victoria, NSW
Who for? Multiple, including Wind Farm Developers (bird & bats), Government departments.
What we did:

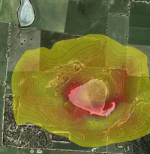
We have developed and applied a number of techniques for spatial habitat and site utilisation mapping. This information can be built up from field observation (using spatial density maps), or can be more predictive (i.e. we might build up a model to predict utilisation from habitat variables). Both methods have been used to allow developers and regulators to literally see and map areas of higher utilisation. Because these maps are fully GIS compliant, they can be directly included in constraint mapping for a site. Because they are underpinned with statistics, we can quantify and communicate the uncertainty and the precision of the maps.© Lee Torrens | Dreamstime.com
These methods can be applied to mapping flora, fauna, potential customers, traffic data etc. Some of the environmental applications we have provided are:
- For Bats - Using a predictive model (and a funky survey design), we could demonstrate higher and lower areas of activity
- For large birds - These are easier to see, so we have built maps of site usage based on direct observation. This is then used to inform precise wind turbine placement to avoid areas of height risk. See references for a link to a conference poster outlining this approach.
- For reptiles - These methods have been used to map the home range and travel habits of carpet pythons in North West Victoria
- Home range movements under specific conditions (e.g. breeding season) - A similar approach was used to determine home ranges for brolgas, during breeding season. This was then used as guidance to inform appropriate buffers, based on real site knowledge.